U.S. Egg Production Maps by State, 2008–2025
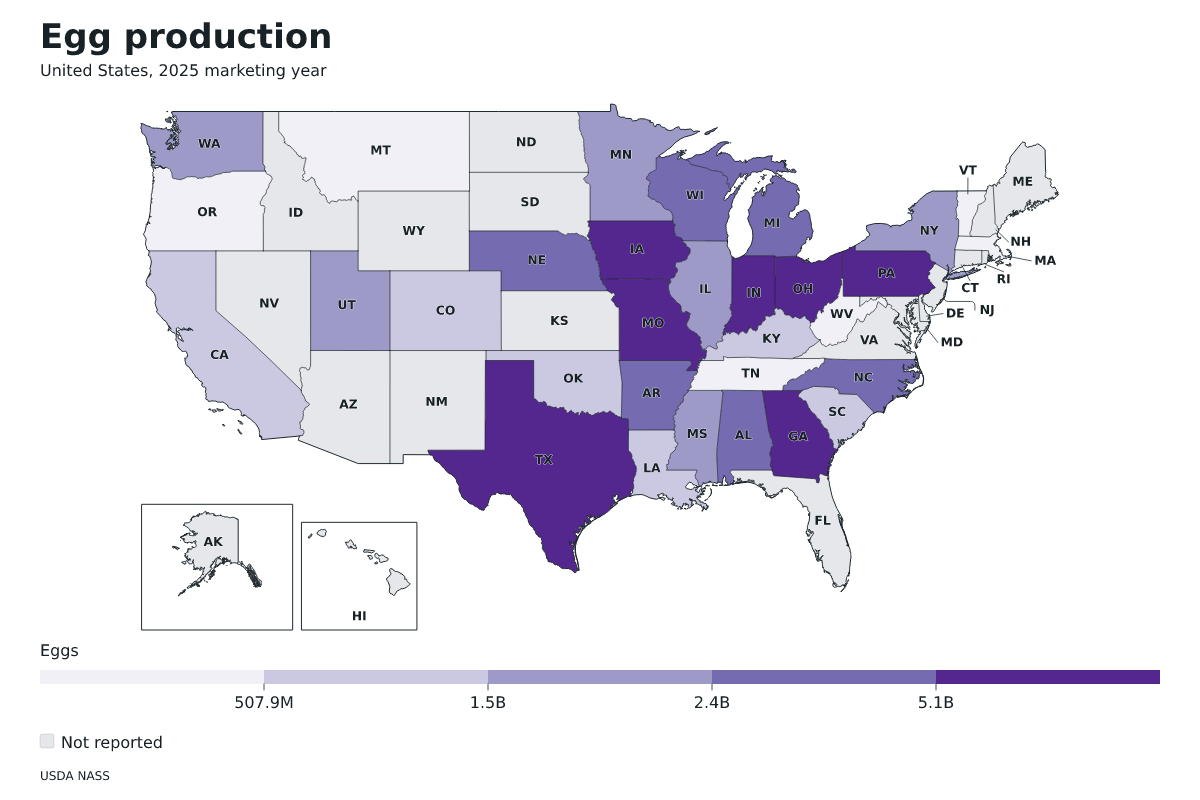
Eggs produced by state during the marketing year. Compare United States state maps from 2008–2025, measured in eggs, using USDA NASS Quick Stats.
Latest map
Eggs produced by state during the marketing year. Egg production by state in United States, 2025 marketing year. Measured in eggs. Source: USDA National Agricultural Statistics Service (NASS). Highest reported values: Iowa: 13,505,600,000 eggs; Ohio: 11,145,000,000 eggs; Indiana: 10,687,200,000 eggs.
Historical years
Explore 18 editions from 2008–2025. Each year links to the published figures, leading regions, source attribution, and missing-value notes. Compare the earliest and latest editions below. The source may revise historical estimates.
2008 marketing year · Highest reported values: Iowa: 14,407,000,000 eggs; Ohio: 7,168,000,000 eggs; Indiana: 6,523,000,000 eggs.
2025 marketing year · Highest reported values: Iowa: 13,505,600,000 eggs; Ohio: 11,145,000,000 eggs; Indiana: 10,687,200,000 eggs.