
Map detailsClose
Sheep population · United States · January 1, 2026
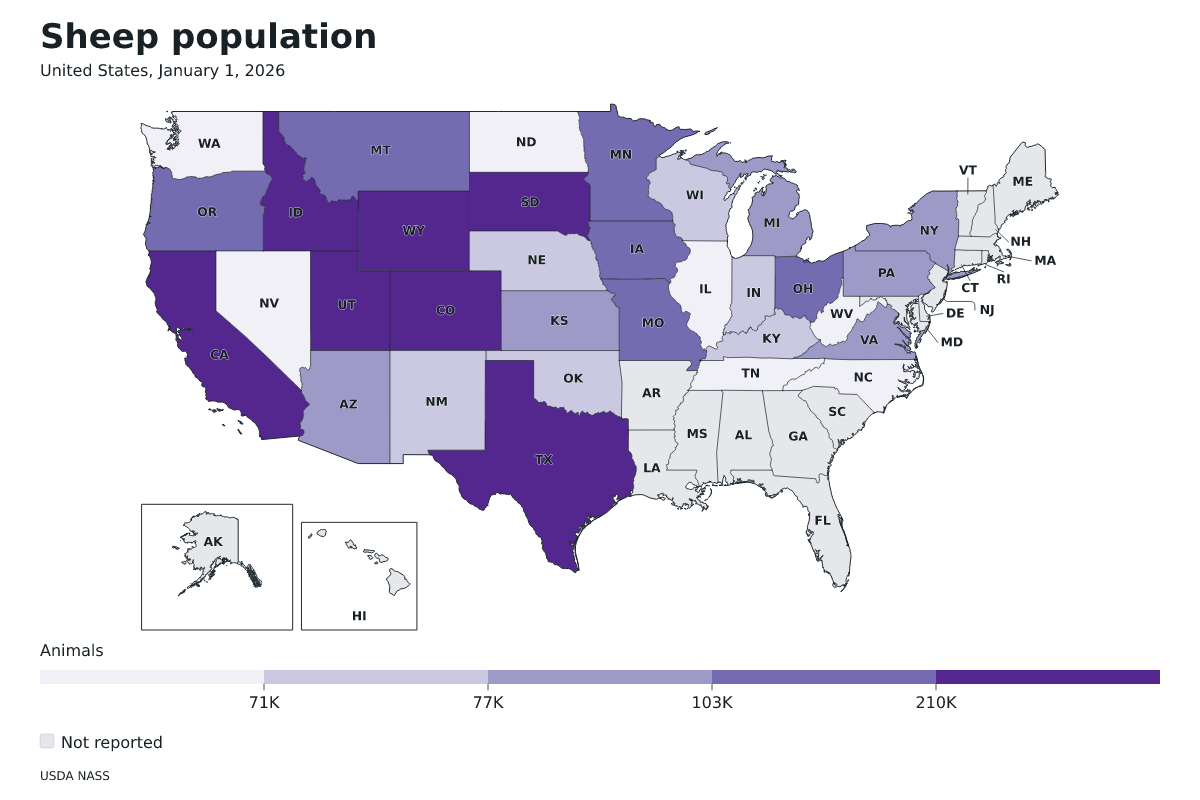
The number of sheep and lambs on January 1.
Sheep population by state in United States, January 1, 2026. Measured in sheep and lambs. Source: USDA National Agricultural Statistics Service (NASS).
Highest reported values: Texas: 700,000 sheep and lambs; California: 505,000 sheep and lambs; Colorado: 410,000 sheep and lambs.
Compare sheep population across United States in a choropleth map for reports and presentations.
Customize this data map
- Choose a color palette or define a custom gradient for the reported values.
- Compare values with a continuous scale or grouped ranges, and adjust the number of ranges.
- Choose a separate fill color for regions without numeric values.
- Show or hide region names and values; adjust their labels, fonts, and text sizes.
- Show or hide the data legend and place it below or beside the map.
- Adjust map boundary colors and line widths.
- Edit the data map title and subtitle, and add annotations to explain the figures.
- Download the data map as SVG, PNG, or PDF for reports, presentations, or print.
- Topic
- Sheep population
- Year
- January 1, 2026
- Measured in
- Sheep and lambs
- Data retrieved
- 2026-10-18
- Location
- North America
- Regions included
- 50
| State | Value | Publication status |
|---|---|---|
| Alabama | — | Not reported |
| Alaska | — | Not reported |
| Arizona | 83,000 | Reported value |
| Arkansas | — | Not reported |
| California | 505,000 | Reported value |
| Colorado | 410,000 | Reported value |
| Connecticut | — | Not reported |
| Delaware | — | Not reported |
| Florida | — | Not reported |
| Georgia | — | Not reported |
| Hawaii | — | Not reported |
| Idaho | 220,000 | Reported value |
| Illinois | 55,000 | Reported value |
| Indiana | 76,000 | Reported value |
| Iowa | 161,000 | Reported value |
| Kansas | 81,000 | Reported value |
| Kentucky | 74,000 | Reported value |
| Louisiana | — | Not reported |
| Maine | — | Not reported |
| Maryland | — | Not reported |
| Massachusetts | — | Not reported |
| Michigan | 85,000 | Reported value |
| Minnesota | 109,000 | Reported value |
| Mississippi | — | Not reported |
| Missouri | 103,000 | Reported value |
| Montana | 180,000 | Reported value |
| Nebraska | 74,000 | Reported value |
| Nevada | 65,000 | Reported value |
| New Hampshire | — | Not reported |
| New Jersey | — | Not reported |
| New Mexico | 71,000 | Reported value |
| New York | 83,000 | Reported value |
| North Carolina | 32,000 | Reported value |
| North Dakota | 58,000 | Reported value |
| Ohio | 138,000 | Reported value |
| Oklahoma | 71,000 | Reported value |
| Oregon | 146,000 | Reported value |
| Pennsylvania | 97,000 | Reported value |
| Rhode Island | — | Not reported |
| South Carolina | — | Not reported |
| South Dakota | 210,000 | Reported value |
| Tennessee | 45,000 | Reported value |
| Texas | 700,000 | Reported value |
| Utah | 275,000 | Reported value |
| Vermont | — | Not reported |
| Virginia | 77,000 | Reported value |
| Washington | 46,000 | Reported value |
| West Virginia | 37,000 | Reported value |
| Wisconsin | 75,000 | Reported value |
| Wyoming | 280,000 | Reported value |
Missing or withheld values are not treated as zero. Rankings use reported numeric values only.
Not reported: no observation is present in the source snapshot. It is not zero.
Available layers
- Background
- Borders
- Subdivisions
Download formats
- svg
- png
Regions included (50)
- Alabama
- Alaska
- Arizona
- Arkansas
- California
- Colorado
- Connecticut
- Delaware
- Florida
- Georgia
- Hawaii
- Idaho
- Illinois
- Indiana
- Iowa
- Kansas
- Kentucky
- Louisiana
- Maine
- Maryland
- Massachusetts
- Michigan
- Minnesota
- Mississippi
- Missouri
- Montana
- Nebraska
- Nevada
- New Hampshire
- New Jersey
- New Mexico
- New York
- North Carolina
- North Dakota
- Ohio
- Oklahoma
- Oregon
- Pennsylvania
- Rhode Island
- South Carolina
- South Dakota
- Tennessee
- Texas
- Utah
- Vermont
- Virginia
- Washington
- West Virginia
- Wisconsin
- Wyoming
Loading map…